Tracking Trend for Self Service Trend Analysis

Trend analysis is one of the most useful tools for understanding the current state of things and their outlook. Is the business improving or deteriorating? Once visualized, trends are easy to spot. A single glance can tell us whether things are converging, diverging, or moving in a certain direction.

The Problem: Ready Historical Data is Out of Reach

For users, creating a trend chart is easy provided that historical data is readily available. Alas, this is often not the case. Let’s consider an example. An application keeps track of projects and all their tasks. Progress is recorded at the task level and information is rolled up to the project level. So far, this is all very typical. We can calculate the “% complete” of each project simply by adding up the hours completed and dividing by the total hours planned. Yet that only gives us the current status.

For trend analysis, we need to know the “% complete” for yesterday, and the day before, and last week going back in time. We may want to see this information broken down by task and grouped by team or subproject. To do so, the system must keep a history of the updates to each task and be able to tell us the number of hours completed on the task at any point in time.

Operational systems, as opposed to specially-designed data warehouses, typically fall short of this requirement in two ways:

  1. The system might simply update the hours on the task without keeping a history. In that case, our user is out of luck.
  2. The system may separately keep timecards. It may be possible to reconstruct the history from the timecards, but that would be outside the reach of our self-service user, if we assume they don’t have SQL and programming skills.

The Solution: Tracking Trend

“Tracking Trend” is a name for a simple feature that makes life easy for self-service users and allows them to trend data. It breaks the problem into three easy steps.

Step One

The first step is for the user to create a report showing current information. The report would show the “% complete” by project, subproject and team as of the time of running the report.

Step Two

The next step is to “Track Trend” on the report that was created in step one. To “Track Trend” means to create a job that runs the report on a schedule specified by the user, for example every day at 10pm, and capture the output into a table.

Step Three

The table created in step two is perfect for creating trend reports. The table has a date/time field indicating each time the report ran. A trend report can show trends at the project level and allow drill-down to the subproject and team level. Creating such a report is well within reach of a self-service user.

Other Example Applications for Tracking Trends

Tracking trend is useful for any calculated metric, such as inventory on hand, net worth, membership renewal rate, support backlog, top-10 list, and much more. Think for example how easy creating a burn-down chart becomes.

Track Trend in Explore Analytics

Explore Analytics makes tracking trend as easy as scheduling a recurring meeting in outlook. You specify the report (created in step one), the schedule, and a name for the table to hold the output. It’s that simple.
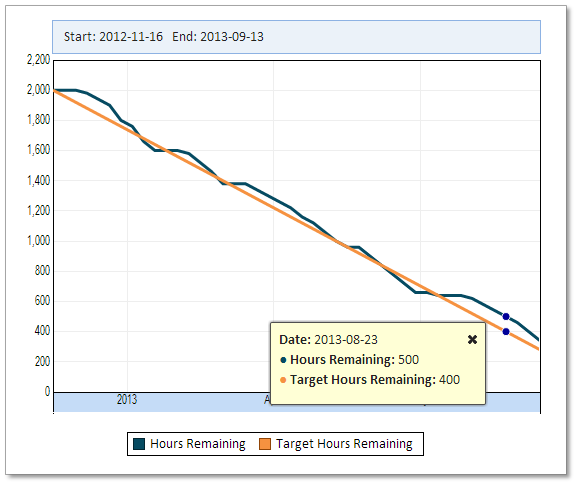
Burn-Down Chart

BI Nirvana with Cloud Data-Access Middleware

“Nirvana” means no more suffering. Those of us who dedicate their career to delivering BI solutions are intimately aware of the pain involved, because before you can even begin to analyze and visualize your data, you need to get access to it, and in a usable form. The good news is that with the move to the cloud, much suffering is finally being alleviated.

Let’s review some of the Impediments to data access:

  • Data needs cleaning, organizing, and cataloging before it can be usable by BI tools
  • Data is locked in systems and applications that lack standards-based data access APIs
  • Security prevents easy online access to the data that users need
  • “Big Data” are datasets that grow so large that they become impractical for traditional BI tools

In short, the systems that hold the data are not designed for BI access. To help with these problems, additional systems are introduced. Data warehousing is the process of taking data from existing systems and staging it in a usable form for query and analysis. For “big data”, large computing clusters use MapReduce to perform analysis.

Nirvana would have been achieved if all data were brought into a data warehouse and made available to all users who need it. But reality is the opposite. Systems holding data are ever more diverse and distributed with no one warehouse to consolidate the data.

Middleware

Data-access middleware connects BI tools with systems that hold data by providing two important facilities:

  • Standard language and API. Typically SQL and JDBC or ODBC API
  • Broad data-source coverage. Including connectivity to databases, data warehouses, applications, and other systems, many of which do not provide a SQL interface

Traditionally, implementing data-access middleware means more software to install, potentially on many desktops, and a constant need to upgrade the middleware to keep up with version changes and new data sources.

Cloud-based Middleware

The reason that I’m so excited about cloud-based middleware is that it solves the issue of software installation and upgrade and when coupled with cloud-based BI tools for analysis and visualization can finally deliver nirvana.

DataDirect Cloud and Explore Analytics

Explore Analytics is the product that I’ve been working on for the last couple of year. It is a cloud-based (SaaS) BI tool for data analysis and visualization. There’s no software to install and all you need is a browser or a mobile browser. The product implements several strategies for data access. The user can import data from spreadsheet, access SaaS applications and cloud databases directly, and access on-premise databases using an agent.

I recently integrated Explore Analytics with DataDirect Cloud, a new product by Progress Software, and I started to feel the nirvana that I’m talking about. DataDirect Cloud brings the strength of DataDirect to the cloud. In doing so, it delivers the benefits that I mentioned before – standard SQL access and broad data-source coverage – but it doesn’t stop there. It goes much further towards nirvana:

  • Setup is incredibly easy. With a single JDBC driver, Explore Analytics gains access to all the types of data sources that DataDirect Cloud supports. Better yet, for the user this is completely transparent, and there’s nothing to install!
  • DataDirect Cloud delivers painless access to SaaS applications such as Salesforce.com, Microsoft Dynamics CRM, and Oracle RightNow (the list of SaaS applications is rapidly growing.)
  • Neither the user, nor Explore analytics, needs to upgrade drivers to keep up with API changes of SaaS applications. DataDirect Cloud takes care of all that.
  • DataDirect has drivers for Big Data and NoSQL. Once delivered in DataDirect Cloud they become immediately available to Explore Analytics customers.
  • Service is by subscription, similar to Explore Analytics.

I tested access to my Salesforce.com developer account by using Explore Analytics via DataDirect Cloud and created the following chart showing US sales opportunities by state and type. The size of each pie represents the total opportunity amount for the state, and it’s broken down by the type of opportunity. It was all done in a few minutes without installing any software or writing any code.

In conclusion, cloud BI tools coupled with cloud middleware can finally deliver data-access nirvana and lead to true self-service. For example, a Salesforce.com customer can perform advance analysis and visualization of their pipeline and sales forecast without installing any software, simply by subscribing to DataDirect Cloud and Explore Analytics. Now that easy!