Proactive Analytics with Alerts

If you’re like me, then you want to keep on top of what’s going on. You want to identify problems and opportunities early, and you want to do so analytically.

An analytical solution gives you a wealth of reports and dashboards. You could start your day by reviewing this information. Alas, after a few days you discover that you don’t really have the time to review all those beautiful reports on a daily basis. You need something more proactive. You need alerts!

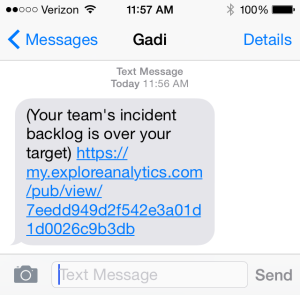
iphone_alert

Alerts are not a new idea, but they are as important as ever. News alerts can tell you when your company is in the news. Stock alerts can tell you if your favorite stock is on the move. The same idea is true for your business analytics.

Turning Reports into Alerts

Consider these simple steps for converting any report, pivot, or chart into an alerting tool.

  • Define a threshold and only display information that crosses that threshold.
  • Schedule the report to text or email you the output only if it has any data.

If you pick the right threshold, you’ll only get a text or email when your attention is needed. For example if there’s a significant change from the previous day, if a commitment was breached, or a key indicator crossed a threshold.

Let’s look at a few examples:

  • You’re about to breach your service-level agreement
  • There’s been a drop in performance with significantly longer wait times
  • Your team’s backlog went above your target limit

Implementation

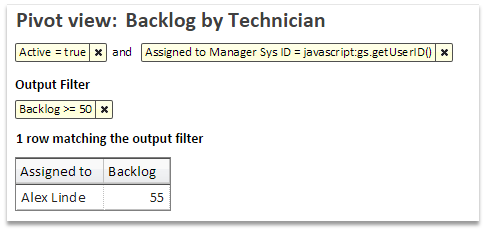
Using Explore Analytics, you can define an output filter. An output filter looks at the output of the report with its aggregated and calculated values and selects only the items that meet the filter selection. For example, if the report summarizes the backlog for each of your team members, the output filter can select members with a backlog of over 50 support tickets. On most days, this report will be empty. When the report is not empty, you’d like to be alerted.

backlog_by_technician

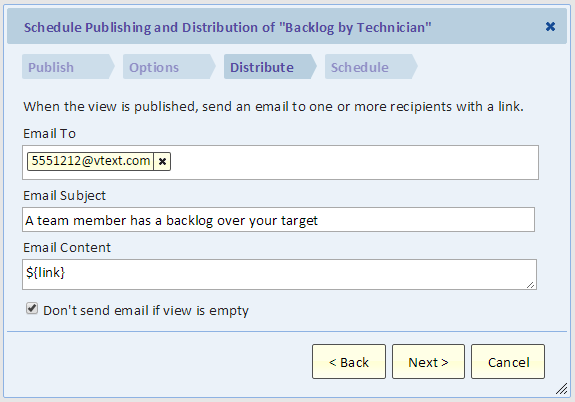
The second step in our implementation using Explore Analytics, is the alerting. We do that by scheduling this report and requesting that it be sent only if it’s not empty.

alert

A couple things to note in the dialog:

  • The email address @vtext.com allows you to send an alert as a text message (SMS) to your phone. The address depends on your mobile carries (the example is using Verizon).
  • The checkbox at the bottom of the dialog means that you will only get the text message if there’s at least one team member with a backlog over 50.

Picking the Alert Threshold

What you want is a text or an email saying “hey, something is going on, you need to take a look.” The message should include the information so that you can immediately act on it.

Therefore, when picking the threshold, consider:

  • Is it actionable? If you’re not going to act on it, then don’t send it.
  • With alerts, you’re looking for exceptions. If you’re going to get the alert every day, then it’s not an exception and you’re likely to say “we should really do something about it” and promptly ignore it.
  • Don’t overwhelm yourself or your team members with too many alerts. Pick the really important ones or set the threshold higher. Let your team members define their own alerts.

Conclusion

Analytical alerts allow you to focus on exceptions and opportunities and proactively manage them. Information is actionable and you can immediately take action or delegate to the right person to take action.
Top 5 Questions to ask when looking for a ServiceNow reporting solution

So you’ve reached the limits of ServiceNow reporting, and you’re interested in taking the next step. Your managers want visibility on their teams’ work, your executives want a deeper understanding of the performance of IT, and your process owners desire a higher level of maturity.

To help you find the best ServiceNow reporting and analytics solution, we’ve pulled together the top five questions to ask of any solution you’re considering.

  1. Is self-service reporting provided?
  2. Are reports actionable in real time?
  3. Can reports be accessed in ServiceNow and elsewhere?
  4. Can reports answer complex questions?
  5. How soon can reports be deployed?

Let’s review each question.

1) Is Self-Service Reporting Provided?

Users expect to own their work and to be able to quickly answer questions. Allowing users self-service to answer their own question is an important attribute of a reporting solution.

Analytics tools are often designed for highly skilled “report administrators” who create reports and dashboards for others. This frequently leads to a resource bottleneck, where users reporting needs must be prioritized and delayed.

Another option is to buy an ITSM dashboard in hope that it has the answers to everyone’s questions. Alas, such a solution prevents any ad hoc reporting capabilities, and expects your user’s needs to fit into a one-size-fits-all approach with limited ability to explore data.

Explore Analytics empowers any user with self service. Using intuitive drag-and-drop controls, Explore Analytics is designed to put power in the hands of users, allow them to explore the data and gain insights. Power users can create sophisticated reports, trends, and scorecards and share those with other users so you get the best of both worlds.

2) Are Reports Actionable in Real Time?

Users must be empowered to take immediate action on information. One important aspect of this is the ability to see up to the minute information. 

Some solutions will propose daily, weekly, or monthly views of the data. While historical reporting is useful for long-term strategy, it must be paired with live, actionable reporting.

Another important aspect is the ability to drill through to the details behind reports. Often, this is another place where users are asked to compromise when you go beyond the out-of-the-box reporting in ServiceNow.

Explore Analytics is the only solution for ServiceNow that provides live, drillable advanced analytics. Even complex reports that calculate data across multiple tables provide real-time drillable information.

3) Can Reports be accessed in ServiceNow and Elsewhere?

ServiceNow users expect to see reports in the ServiceNow user interface while non-IT users may prefer to get these reports by email or see them in a portal such as SharePoint.

Many third-party solutions are delivered outside of the ServiceNow user interface.

Explore Analytics integrates seamlessly into the native ServiceNow dashboards, with no additional passwords or set-up to view them. For non-ServiceNow users, fully interactive Explore Analytics reports can be emailed or embedded in any Web page or portal such as SharePoint.

These reports are fully interactive, allowing users to drill-down, drill through to details, reformat and adjust the reports as desired, and do that right in the dashboard.

4) Can Reports Answer Complex Questions?

When considering a reporting solution, consider whether the following is possible to do:

  • Allow any user to create live, ad hoc multi-level pivot reports?

  • Allow any user to combine data from multiple tables (or indeed multiple data sources) without needing to understand complex database concepts?

  • Allow any user to perform calculations against the data without requiring code?

  • Allow any user to drill down any number of levels in the reporting view?

With Explore Analytics, the answers to the above questions are all yes.

5) How Soon Can Reports Be Deployed?

Reporting solutions that periodically copy ServiceNow data into a warehouse require considerable up-front work by specialized people and on-going maintenance. Security access control rules have to be reproduced in the warehouse. This setup must happen before reports can be deployed.

With Explore Analytics, the technical deployment can be done within minutes because it understands ServiceNow natively. Security rules in ServiceNow are respected and users only see the portions of the data that they are allowed to see.  All that’s needed to get started with Explore Analytics is to apply an update set, create a service account, and the integration will set itself up.

Explore Analytics is easy to use. Users get up to speed swiftly with quick enablement videos.

Even better, you can leverage the predefined Analytical Application for ITSM to get immediate insight and value. The app is complete with pre-built dashboards and reports that leverage best practices. The app is built using the same intuitive self-service interface, and is easily adjusted to fit your unique environment.

Conclusion

Explore Analytics is designed for ServiceNow. It provides self-service ad-hoc data reporting, advanced reporting and analytics, trending and scorecards, and provides it all without forcing tradeoffs and compromises.

To see for yourself how Explore Analytics will fit your needs, you can see the live demo environment, or sign up for a free evaluation to try it against your own data and get going in minutes!