The XY chart is great for visualizing relationships between numerical data and finding correlations. Data can be presented as a scatter plot or a bubble chart. Let’s start with a scatter plot using an example.
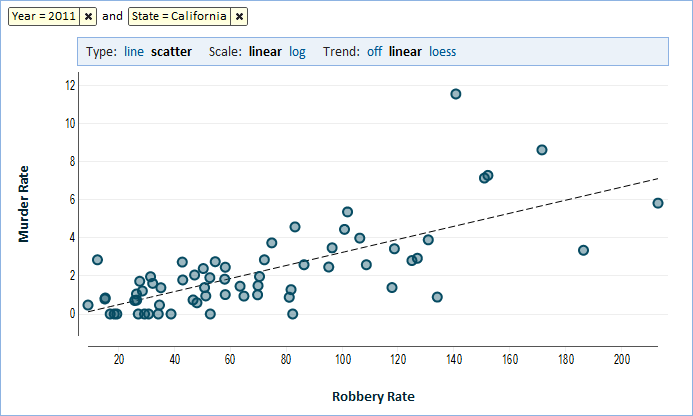
Our example is based on a table of crime rates in US cities of 100,000 people or more. In this scatter plot, we have a point for every city in California in 2011. We also drew a linear trend line to visualize the possible correlation. As you can see, there is some correlation between the two types of crimes. Cities with a higher robbery rate tend to also have a higher murder rate. Nevertheless, the correlation is not very strong with some points far from the trend line indicating cities where one rate fails to predict the other rate.
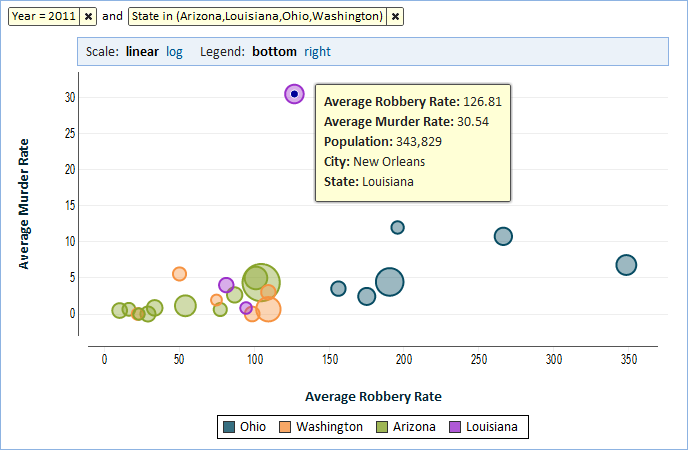
The next XY chart is a bubble chart. In a bubble chart we show a third numerical value, in this case population. We represent this third value by varying the size of each point which we now call a bubble. We make the area of the bubble proportional to the value and therefore larger bubbles represent cities with larger populations.
The chart also demonstrates the capability to examine outliers. In our chart, we see one bubble with an exceptionally high murder rate. When we hover the mouse over it (or touch it on a touch device) we see more detail. In our example we see that the city is New Orleans.
We show you how to create an XY Chart and show you more capabilities in the following video:

