You probably don’t need convincing that interactive charts are far superior to static ones. There are many ways of making charts interactive by allowing the viewer to drill down to the next level of summary, drill-through to details, or simply allowing users to change properties of the chart such as zoom level or scale.
In this short article, I’d like to show you another nifty (simple yet powerful) interaction. This one is designed to let the user choose between focusing on a calculated metric or seeing how the calculation was made. We’ll show it by example.
Consider data about last year’s budget for some fictitious company. Since it’s last year’s, we also have the actual spending and we can analyze the difference between the amount budgeted and the actual amount spent for each account. The data that we have includes the account name (e.g., “Marketing & advertising”), the type (“Budget” or “Actual”) and the amount.
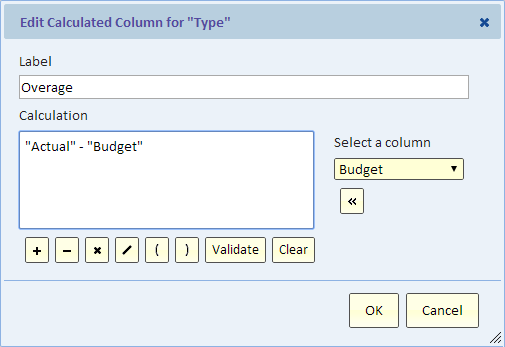
In the process of creating the chart, we define a calculated column called “Overage” that’s simply calculated as “Actual” minus “Budget”.
A positive “Overage” means that we went over budget, and a negative one means that we were under budget.
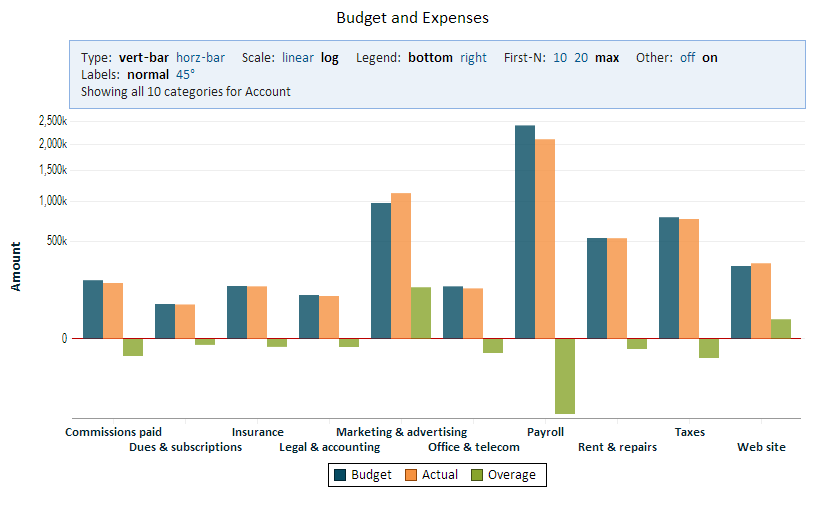
This chart shows all three “types”: Budget, Actual, and Overage.
This is nice because we can see all the information, but it’s a bit busy and it’s hard to see the overage where it’s small. The solution is elegant, just click on the legend and select what you want to see:
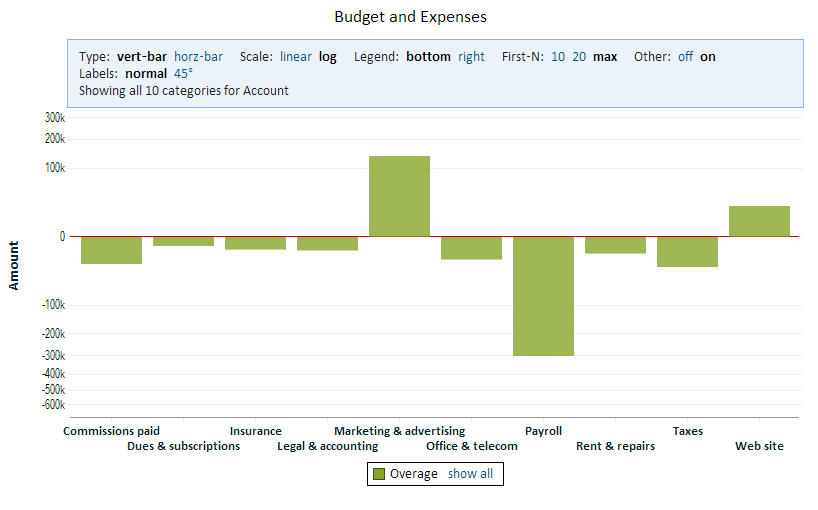
The result of keeping only “Overage” is this:
To try this yourself, click on the above chart to go to the interactive chart.
In Explore Analytics, the legend selection functionality is always available for category and timeline charts, so you can try it today with your own charts.


